

The following article contains everything you need to know about the best practices and dangers of...
Read More
Atlassian Jira Jira Cloud Implementation & Configuration ITSM
IT Service Management (ITSM) is fundamentally about delivering IT as a service and treating stakeholders as customers, working quickly and efficiently to deliver the best service possible. A key part of this is tracking and measuring performance and results – what gets measured gets improved, after all.
In this guide, we’ll explore how to track performance in Jira Service Management (JSM) and best practices around measuring results and identifying areas for improvement.
Defining IT Metrics
IT programs come with a huge range of indicators and statistics that can be measured, so an important starting point is to define a limited number of Key Performance Indicators (KPIs) to focus on.
These metrics should be measurable and should describe a key element of IT delivery. Notably, they’ll also be specific to the work and priorities of your team and organisation.
Performance metrics in ITSM can be broadly divided between service delivery and incident response. If an incident means you cannot deliver your service for your customers, whether because a website is down or you can’t process payments, it’s obviously crucial to address the issue as soon as possible. Given this, it’s important for your KPIs to track when incidents occur and how they’re resolved.
Some commonly used metrics include:
- MTTR (Mean Time to Recovery, Repair, Respond, or Resolve) – This tracks the speed with which issues and incidents are dealt with. You’ll have to also determine which of the four Rs is most relevant for your use case, selecting from:
- Response – The response time for a new issue – similar to Mean Time To Acknowledge, counting the average time from an alert to work starting.
- Repair – The time taken to fix the issue.
- Resolve – The time from an issue being opened to it being closed.
- Recovery – The time from an issue being identified to it being addressed and solved).
- Size of request backlog – The raw number of unresolved requests.
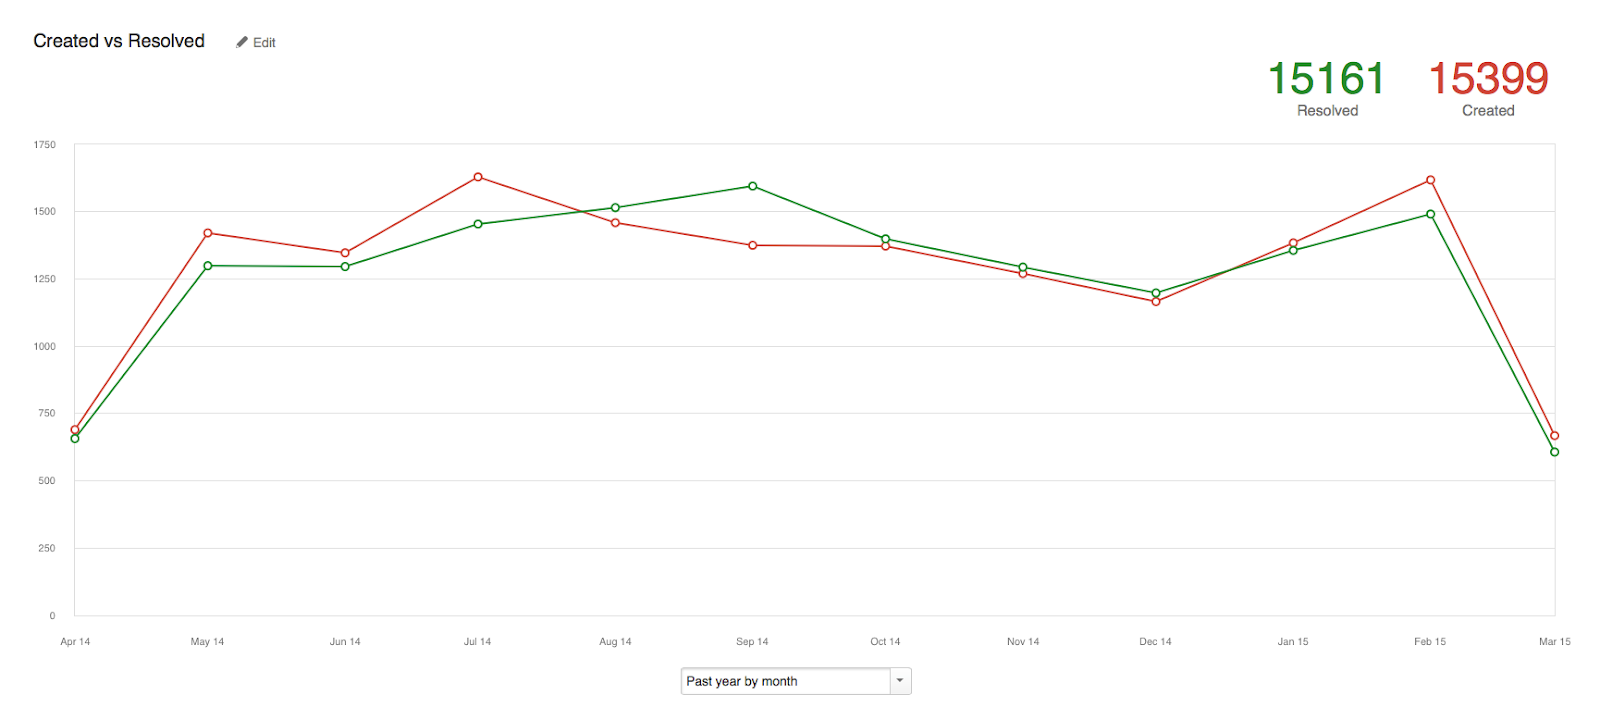
- Created versus resolved – The number of issues created overtime against the number resolved.
- Cost Per Ticket – The cost of your service and support team and your tools measured against the number of issues reported.
- Customer Satisfaction (CSAT) – Quantifiable stakeholder feedback on the quality of your delivery.
- Service Level Agreement (SLA) success rate – SLAs are formal commitments to a certain level of service, often taking in other metrics, such as uptime. Your success rate is determined by the consistency with which your team meets its SLA obligations.
Some metrics are more geared toward tracking incident response – such as:
- Incidents over time – The frequency with which incidents and major incidents occur
- Uptime – The percent of time that the core service is available and functional
- MTBF (Mean Time Before Failure) – The average time between repeatable product failures, indicating availability and reliability. This metric originated in aviation where failures are (evidently) particularly significant.
- MTTF (Mean Time to Failure) – The average time between failures of a product that can’t be repaired. This works best to track replaceable items with a short life span.
- Percentage of incidents resolved within SLA – The success rate for meeting obligations for incidents defined in the SLA.
- Percentage of outages due to incidents – The rate of outages caused by incidents.
Tracking Metrics Over Time
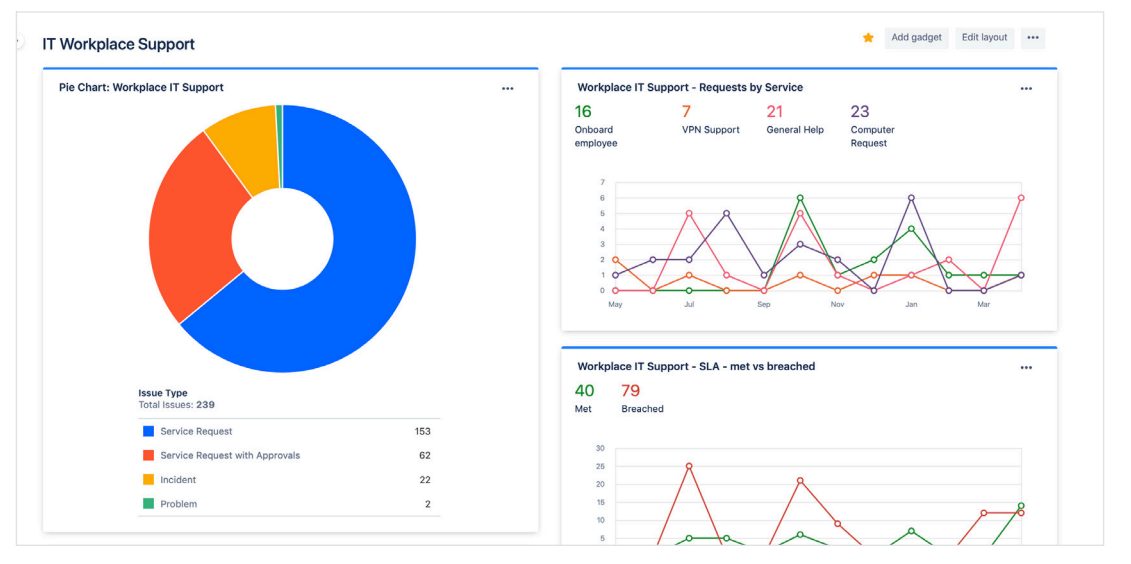
JSM enables you to create custom reports and dashboards for specific metrics, so you can follow them. In some cases, you’ll want to view stats in isolation, such as when tracking incidents or issues created over time or by period, while in others, you’ll want to compare two or more values, such as issues created against issues resolved.
Analyzing your KPIs can help to identify and address issues. For example, if Mean Time Between Failures is concerningly short, there may be a common cause for the issues or you may need to put more robust processes and systems in place to prevent failure. Similarly, if Mean Time To Acknowledge is high, there may be confusion over who is responsible for handling incoming issues.
Tracking performance will also assist in setting objectives – do you want to maintain a baseline, for example, or drive better results, with faster response times and fewer issues?
JSM ITSM Reports
JSM allows you to create a range of reports which are invaluable for tracking KPIs.
Default reports for Jira Service Management Cloud cannot be changed. They include:
- Workload – The number of issues assigned to your team.
- Satisfaction – Your team’s average customer satisfaction rating.
- Requests resolved – The number of closed requests.
- Requests deflected – The number of times customers viewed knowledge base articles and found them useful.
You can also edit and create custom reports for your goals. The following reports are included automatically:
- Service requests – Service requests sorted by type.
- Created vs resolved – The number of issues created against those resolved over time.
- Time to resolution – The length of time to resolve issues of a given priority or type.
- SLA met vs breached – The number of issues that met an SLA goal against those that breached it.
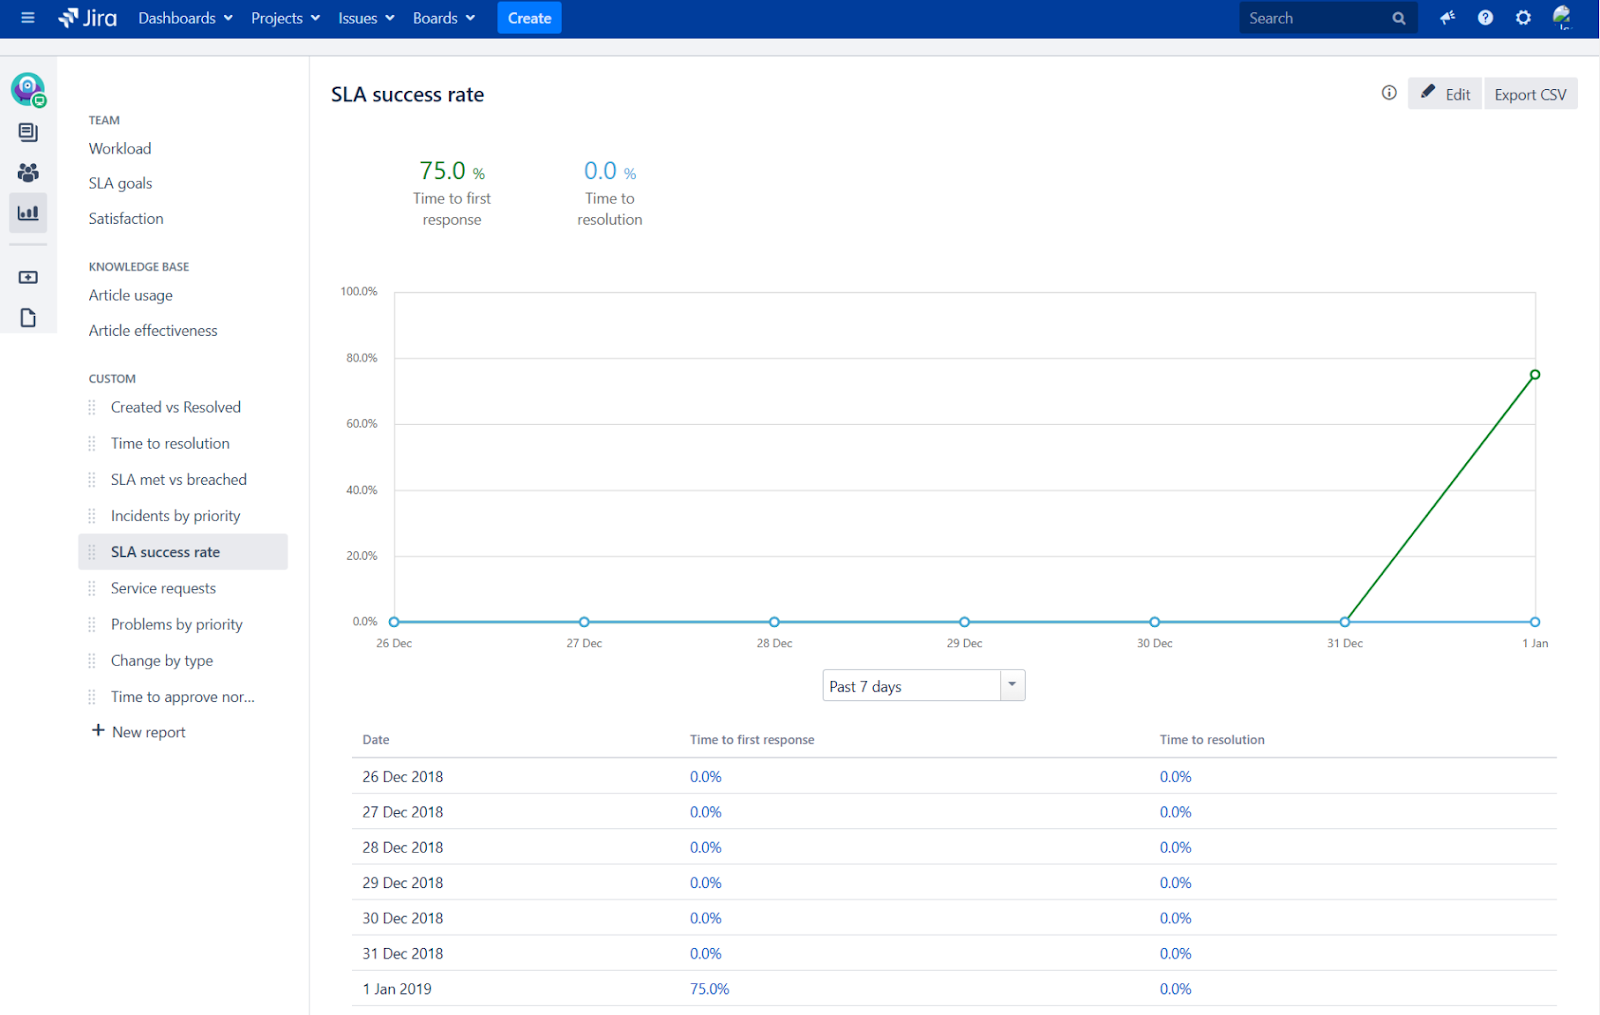
- SLA success rate – Performance against SLA goals.
- Incidents/problems by priority – The number of reported incidents by priority (for IT service projects).
- Change by type – The number of standard, normal, and emergency changes made (for change management).
- Time to approve normal change – The time for a change to be applied (for change management).
You can add reports to dashboards and create dashboards to track specific metrics. You can also build custom reports using JQL to get exactly the information you need. This gives you an enormous amount of power to drill into the data and extract actionable data points.
Customer Satisfaction (CSAT)
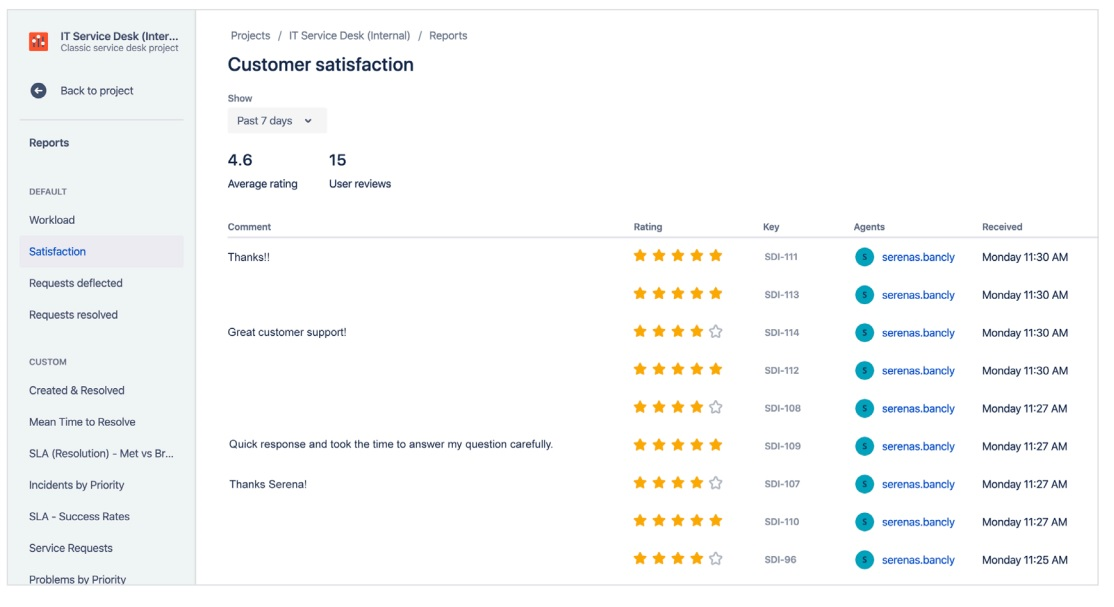
Stakeholder feedback is an important metric for determining the success of your work. JSM includes built-in satisfaction surveys, which allow individuals to leave a star rating, from one to five, alongside additional comments.
This allows stakeholders to quickly leave feedback with both a broad indication of their satisfaction and room to provide detail on the reason for their rating and how delivery could be improved.
Service Level Agreements (SLAs)
SLAs enable you to manage customer and stakeholder expectations by defining a set level of delivery. JSM enables you to create SLAs based on whatever metrics you want, and you can access reports to track SLA delivery in real-time.
You’ll want to ensure your Service Level Objectives (SLOs) are achievable, and you should make sure that they’re specific and measurable. Many firms make commitments around uptime, for example, where 99.9% is seen as good and 99.99% is excellent – but 100% is unrealistic.
You should monitor your SLA performance over time and communicate your results to your stakeholders. Depending on circumstances, you may also want to change your objectives – for example, committing to a higher level of service.
To create an SLA in JSM:
- Go to “Project settings,” and then “SLAs,” and click on “Add SLA”
- You can then name the SLA (note that this cannot be changed later)
- You can then set the conditions and goals of the SLA, including up to 30 goals (and you can use JQL to define the issues to be tracked)
- When you’re done, click “Save” and your SLA is logged in the system
Best Practice for Tracking ITSM Performance in JSM
Gauging the performance of your IT team relies on selecting appropriate metrics and effectively communicating this data alongside your plans for iterative improvement. These best practice points will help you to effectively track performance and convey your findings within your organization and to external stakeholders.
Match performance metrics to the relevant stakeholders
Different stakeholders need different information, so providing the same report to all parties is likely to be unhelpful. For example, an IT manager will likely want granular, technical information, while a C-level executive may well prefer a high-level overview. Consider what details are wanted and agree on these before building out reports.
Communicate information visually
When reporting to stakeholders and tracking metrics for your own purposes it’s useful to present information in a visual format using charts, rather than just delivering tables of data. This allows you to present a story about how you’re performing against your goals and benchmarks and to track progress in an accessible format.
JSM’s default dashboards are a good start for this but consider whether you need additional reports to communicate metrics that are specific to your team.
You should also consider the context of reports – such as comparing performance against the previous month, the previous quarter, and the previous 12 months, depending on your priorities and business cycle. This may highlight issues that would otherwise be missed if the data were inspected in isolation.
Connect IT performance goals to business goals
It’s important to make sure that your IT targets match your organisation’s priorities. If consistent availability is important, then key metrics might include uptime, Mean Time To Recovery, and Mean Time Before Failure.
If you prioritize turning tickets around quickly, however – solving issues without looking more deeply into them – you may find you’re passing on costs to the rest of the organization.
Use a scorecard to report fundamentals
Boiling down your key metrics into a scorecard can be a helpful, accessible way to provide a high-level report on your delivery. This can be a simple red, yellow, and green light system, indicating the status of your key measurables for your team and your stakeholders.
Follow metrics to root causes
While your KPIs will highlight issues, they won’t tell you how to fix them. Be mindful of the baselines you’re comparing against and dig down into how and why issues are occurring.
Just as you should avoid swamping your team and stakeholders with data, bear in mind that KPIs will miss out crucial details, such as why one problem took much longer to solve than another or why one technical failure was much more costly than another.
Use SLAs effectively
SLAs can easily become cumbersome, so it can make sense to have multiple, simple SLAs rather than a single, more complex module.
Equally, if you are tracking metrics like time to resolution in the SLA, make sure to set rules to stop counting time for eventualities such as waiting for customer feedback. This ensures the team is being measured for their performance rather than factors beyond their control.
Conclusion
ITSM is all about delivering services more efficiently and more effectively, so gauging performance is fundamental to iterative improvement. Managers need to put aside vanity metrics and the job of merely tracking work completed and ensuring that they identify the measurables that are driving performance and improvement.
Effectively delivering an ITSM program can have huge benefits for almost any organization. Being able to optimize and iterate will enable the IT department to chart a path forward – cutting costs while increasing and enhancing the delivery and boosting stakeholder satisfaction.
Recommended Reads:
- ITSM Workflows and Automation in Jira Service Management
- Mastering Atlassian Intelligence: AI Insights in the Ecosystem.
- ITSM Workflows and Automation in Jira Service Management: A How-to Guide
- Mastering Jira Service Management Automation: A Guide for Team-Managed Projects
- ESM vs. ITSM: Key Differences in Enterprise and IT Service Management

